 StreamLive Pro
Export your analytics to CSV or a PDF report
Export social media analytics from StreamLive Pro: a CSV of numbers per day, a CSV of every post, or a PDF report of the account and period on screen.
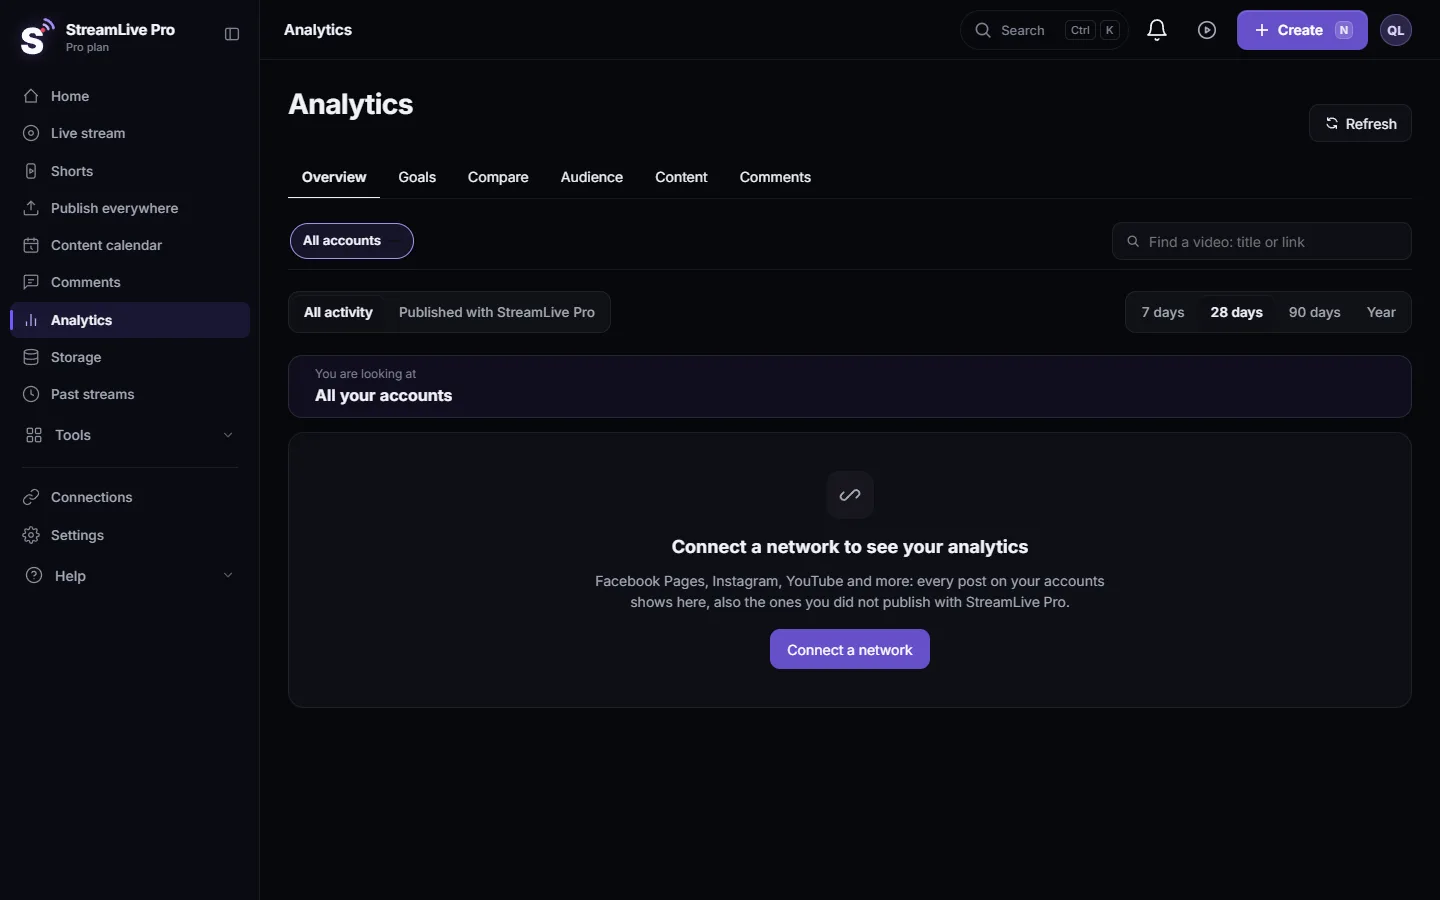
Analytics has three exports, in a card called Report and export at the bottom of the Overview and Compare tabs, and as buttons on the Audience tab. CSV per day gives one row per date with views, reach, interactions, watch time, posts, lives and follower change. CSV of posts gives one row per post with its link and numbers. PDF report opens a printable report that you save as a PDF from the browser's print window. Each export covers exactly what is on screen: the account or accounts in the switcher, and the period you picked.
Before you start
- The accounts are shown in Analytics and have been read at least once. See Read your social media analytics for every account.
- Choose the scope in the account switcher at the top: All accounts, all accounts of one network, or one Page, channel or profile.
- Choose the period: 7 days, 28 days, 90 days or Year (28 days, 90 days or Year on the Audience tab).
Steps
- Open Analytics. Click Analytics, choose the account and the period.
- Find the export card. Scroll to the bottom of Overview (or Compare) to Report and export. Its subtitle repeats what will be exported, for example "All accounts · last 28 days". On the Audience tab the buttons sit in the bar at the top.
- Download the numbers per day. Click CSV per day. A file named like streamlive-daily-(account)-(from)-(to).csv downloads.
- Download the posts. Click CSV of posts for every post of the period, newest first.
- Make the report. Click PDF report. A preview opens; when it has loaded, click Save as PDF and in the print window choose "Save as PDF" as the printer.
- Open the CSV. Excel, Google Sheets and Numbers open it directly. The headers are in the language of your dashboard, and Hebrew text shows correctly in Excel.
What is in each file
| Export | Rows | Columns |
|---|---|---|
| CSV per day | One per date of the period | Date, Views, Reach, Interactions, Watch time (minutes), Posts, Lives, Followers change |
| CSV of posts | One per post published in the period | Published, Account, Network, Type, Title, Link, Views, Reach, Likes, Comments, Shares, Saves, Watch time, average watch, Engagement rate % |
| PDF report | A page to print or save | Key numbers with the change against the previous period, numbers per day (the latest 31 days; the CSV has every day), top posts, every account, goals, and for one account its audience |
An empty cell means the network does not give that number; nothing is estimated. For example a Facebook Page without the insights permission has no views, and TikTok has numbers only when TikTok's extra permission is on for your account. Each network counts a view its own way, so totals across networks are a sum, not a like-for-like comparison.
Good uses
- A monthly report for a client or a manager. Choose the client's account and 28 days, then PDF report. For example on the first of each month.
- Your own charts. CSV per day into a spreadsheet, then chart any column.
- A list of posts to review. CSV of posts, sorted by Engagement rate %, shows which topics worked beyond raw views.
What can go wrong
| Problem | Fix |
|---|---|
| "Could not download. Try again." | Wait a moment and click again; check that the browser allows downloads from the site |
| The PDF has only the latest 31 days | That is the report's layout. Use CSV per day for every day of a long period |
| Columns are empty for one network | That network does not give the number, or the connection needs a permission: Reconnect a channel whose connection expired |
| Excel shows one long column | Open the file through Excel's Data, From Text/CSV, and choose comma as the separator |
| The report shows other posts than "Published with StreamLive Pro" | Exports cover everything on the accounts shown. Choose one account in the switcher to narrow it |
Related pages
- Compare this period with the previous one in Analytics
- Set weekly and monthly goals in Analytics
- Analytics: every account, every post, your audience
Frequently asked questions
Can I export my social media analytics to Excel?
Yes. CSV per day and CSV of posts open in Excel, Google Sheets or Numbers. Hebrew text displays correctly.
How do I get a PDF report?
Click PDF report in the Report and export card, wait for the preview, click Save as PDF and choose Save as PDF in the browser's print window.
Can I export one account only?
Yes. Choose that account in the switcher at the top of Analytics before you export. The card's subtitle shows which account will be exported.
Does the export include posts I did not publish with StreamLive Pro?
Yes. It includes every post on the accounts shown in Analytics, wherever it was published from.
Is exporting on every plan?
Analytics and its exports are part of the dashboard on every plan. Each network decides which numbers it gives.
Keep reading
Compare your social accounts side by side in Analytics: a ranking, 2 to 4 accounts in columns, and account vs account per follower, fair to small Pages.
The Audience tab: age, countries, devices and hoursThe Audience tab in Analytics shows who follows or watches one account: age and gender, countries and cities, devices, subscribers, and when followers are online.
Find a post in Analytics: search, sort, paste a linkFind any post or video in Analytics: search by words of the title, paste the post's link, filter videos, lives or posts, and sort by views or engagement.
Analytics for one post: reach, engagement and audienceRead the analytics of a single post or video: how it ranks against your usual, reach and traffic sources, the retention curve, audience, and why a number can be missing.
Want to try it? 7-day trial, no credit card.
Start free