 StreamLive Pro
Read your social media analytics for every account
Read social media analytics for YouTube, Facebook, Instagram, Threads and Twitch in one place: what to check first, how to compare, which networks give no numbers.
Analytics reads the posts, videos, Reels and lives on your connected accounts, wherever they were published from, and puts their numbers side by side. This page is a working routine: what to switch on, what to look at first each week, and how to tell a strong post from a weak one when the totals are small.
For what every tab and number means, see Analytics: every account, every post, your audience. For numbers during a live broadcast, see See live viewers from YouTube and Facebook together.
Before you start
- Accounts connected in Connections. Analytics reads Facebook Pages, Instagram accounts, YouTube channels, Threads profiles and Twitch.
- Some networks give apps no numbers today: TikTok, LinkedIn, X, Pinterest and Kick show "No numbers from this network". Use their own dashboards for those.
- A personal Facebook profile gives no numbers to any app. Only Pages do.
- Analytics is read-only. It never posts, comments or changes anything on your accounts.
Steps
- Choose which accounts Analytics reads. Open Analytics and click Choose what Analytics shows. Switch on each Page, channel or profile you want. This switch is separate from publishing: an account can be in Analytics without being a place you publish to, and removing it from Analytics does not change publishing.
- Wait for the first read. A newly switched-on account is read back 90 days. The first numbers usually arrive within a minute or two, and the page updates by itself.
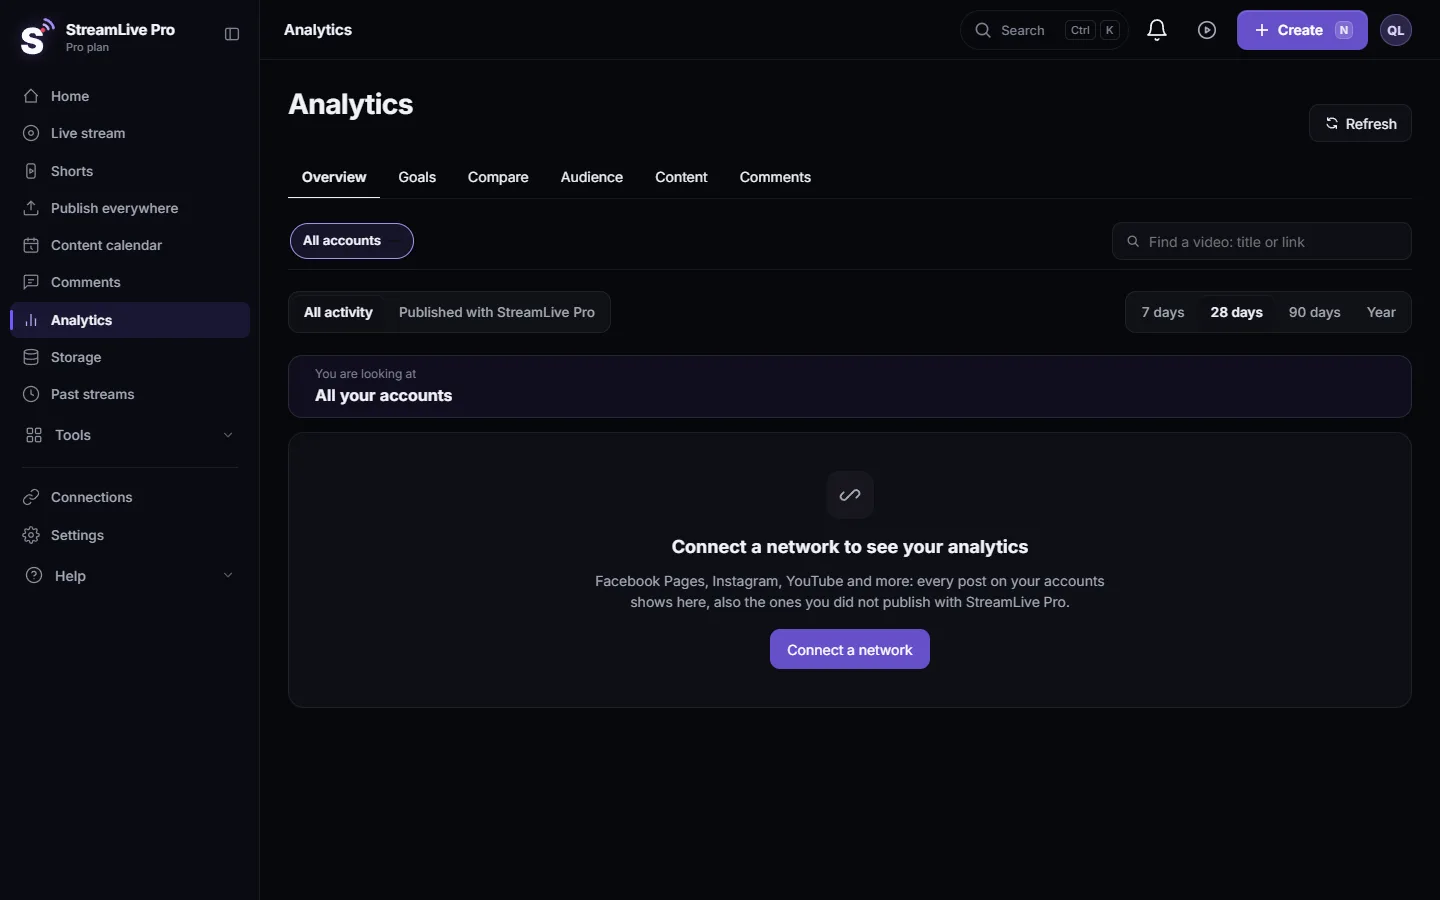
- Pick the scope. At the top choose All activity (everything on your accounts) or Published with StreamLive Pro (only what went out from here). Next to it, the account switcher: All accounts, one network, or one account.
- Pick the period. 7 days, 28 days, 90 days or Year. Every change is measured against the previous period of the same length.
- Read the Overview top to bottom. Start with the key numbers and their change, then By network, then Best posts and Best time to post. Hover a tile to see its trend.
- Open the posts that stand out. In the Content tab sort by Most views or Most interactions and click a row. The post page tells you how it ranks against your own recent posts on that account, and gives likes, comments and shares per 100 views.
- Compare accounts. Under Compare choose 2 to 4 accounts to see them side by side: views, share of all views, change, reach, followers and engagement.
- Set goals if you want them. Under Goals set weekly or monthly targets; progress shows as rings.
- Refresh when you need today's numbers. Accounts are read again every 30 minutes while you use Analytics, otherwise every few hours. Read every account again now forces a fresh read.
A weekly routine that works
For example, on Sunday morning:
| Look at | Question it answers | Where |
|---|---|---|
| Views, change vs previous 7 days | Is the week up or down? | Overview, key numbers |
| By network | Which network carried the week? | Overview |
| Best posts | Which topic or format to repeat? | Overview, then the post page |
| Rates per 100 views | Did a small post do well for its size? | Post page |
| Best time to post | When to schedule next week | Overview heatmap |
| Via StreamLive Pro | What the posts from here brought | Overview, or scope Published with StreamLive Pro |
Then schedule next week's posts at the hours the heatmap shows: Schedule social media posts to several networks at once.
Small numbers: read rates, not totals
A post with 300 views tells you little as a total. The post page compares it with your typical post on the same account, at the same age when we have readings for it, and shows likes, comments and shares per 100 views against your usual. A line such as "better than 80% of your posts" (an example) on a small account is a real signal; a raw total is not.
What can go wrong
| What you see | Why | Fix |
|---|---|---|
| No numbers from this network | The network gives apps no data (for example TikTok or LinkedIn) | Use the network's own dashboard |
| Needs a permission | The connection lacks a read permission, for example Facebook insights | Click Reconnect and approve every permission |
| Watch time missing on a new YouTube video | YouTube gives it about 48 hours after publishing | Check again in two days |
| A Facebook account says not available | It is a personal profile | Connect a Page |
| Our total differs from YouTube Studio | Different period, or numbers still arriving | Compare the same dates; refresh |
Related pages
- Analytics: every account, every post, your audience
- Analytics and viewers — what the numbers mean
- See live viewers from YouTube and Facebook together
- Reconnect a channel whose connection expired
Frequently asked questions
Does Analytics show posts I did not publish with StreamLive Pro?
Yes. All activity includes everything on the accounts you switched on. Choose Published with StreamLive Pro to see only what went out from here.
Can I see TikTok numbers in StreamLive Pro?
Not today. TikTok, LinkedIn, X, Pinterest and Kick give no numbers to Analytics, and the account says so. Use TikTok's own analytics for those.
How far back does Analytics go?
When you switch an account on, it reads the last 90 days. From then on it keeps reading, and the Year period shows up to a year once that history exists.
How often are the numbers updated?
Every 30 minutes for accounts you looked at in the last few days, otherwise every few hours. You can force a fresh read at any time.
Does Analytics cost extra?
No. It is part of the dashboard on every plan. Each network decides which numbers it gives.
Keep reading
Export social media analytics from StreamLive Pro: a CSV of numbers per day, a CSV of every post, or a PDF report of the account and period on screen.
Compare two accounts in Analytics, per followerCompare your social accounts side by side in Analytics: a ranking, 2 to 4 accounts in columns, and account vs account per follower, fair to small Pages.
The Audience tab: age, countries, devices and hoursThe Audience tab in Analytics shows who follows or watches one account: age and gender, countries and cities, devices, subscribers, and when followers are online.
Find a post in Analytics: search, sort, paste a linkFind any post or video in Analytics: search by words of the title, paste the post's link, filter videos, lives or posts, and sort by views or engagement.
Want to try it? 7-day trial, no credit card.
Start free