 StreamLive Pro
Compare this period with the previous one in Analytics
Compare analytics periods in StreamLive Pro: every number is measured against the previous period of the same length. How to read the change and when it is hidden.
In Analytics you do not set two date ranges by hand. You pick a period (7 days, 28 days, 90 days or Year) and every key number is compared with the period of the same length just before it. This week against last week, these 28 days against the 28 before. On the Compare tab you can also put this month against last month, or this week against last week, counted over the same number of days. The change shows as a percentage next to each number. When there is not enough data about the earlier period, the change is left out rather than shown as a misleading figure.
Before you start
- Accounts switched on in Analytics. Facebook Pages, Instagram accounts, YouTube channels, Threads and Twitch are read. TikTok, LinkedIn, X, Pinterest and Kick give Analytics no numbers today. See Read your social media analytics for every account.
- History. A newly switched-on account is read 90 days back. A 7-day or 28-day comparison works at once; comparing the last 90 days with the 90 before needs history that builds up from the day you connect.
- Days are calendar days in your time zone, so "7 days" means the last seven dates on your calendar, not 168 hours.
Steps
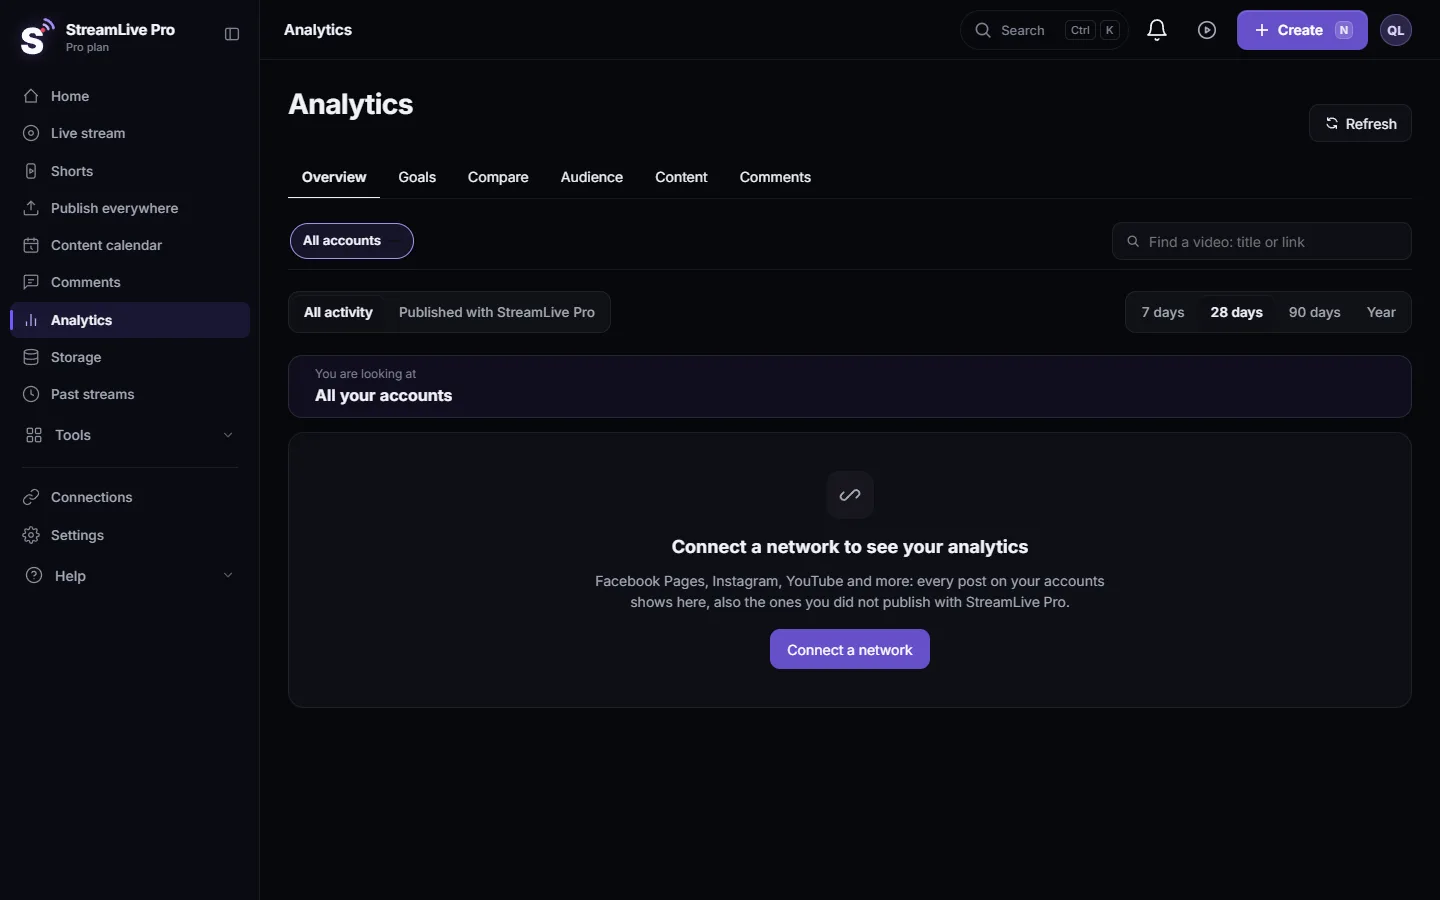
- Open Analytics. Choose Analytics. The Overview tab opens.
- Choose what to compare. In the account switcher at the top choose All accounts, all of one network, or one Page, channel or profile. Next to it choose the scope: All activity, or Published with StreamLive Pro.
- Choose the period. 7 days, 28 days, 90 days or Year. The previous period is always the same length, right before it.
- Read the key numbers. Views, interactions, watch time, posts and followers each show the value for this period and the change against the previous one.
- Open the deeper comparison. Further down, "This period vs before" puts this period, the previous one and your typical day side by side, and "Change vs before" gives the difference.
- Compare accounts over the same period. In the Compare tab choose 2 to 4 accounts. Each row shows its views, its change against its own previous period, reach, followers and engagement rate.
- Ask from a chat if you prefer. With ChatGPT or Claude connected, "How did this week go compared with last week?" returns the same kind of summary per network. See Use StreamLive Pro from ChatGPT and Claude.
How to read the change
| You see | It means |
|---|---|
| A percentage up or down | This period against the previous one of the same length, for the accounts and scope you chose |
| No change shown | Too few days of data about the previous period, for example an account switched on recently |
| Followers with a change | Only accounts where the network reports the count at the start of the period are counted in the change; the others count in the total only |
| Posts up, views down | More posts, each reaching fewer people. Check the post pages before posting more |
Compare like with like. A 7-day period that holds a holiday, or a week with one viral post, swings the percentage a lot. For a trend, use 28 or 90 days; for a quick weekly check, 7 days.
Common questions about the numbers
- Why does a small account show +300%? From 20 views to 80 is +300%. Read the number next to the percentage, not only the percentage.
- Why does YouTube Studio show a different total? Different dates, or numbers that are still arriving. YouTube gives watch time about 48 hours after publishing. Compare the same dates.
- Can I compare two specific months? Not as a custom range. Use the period buttons, or the monthly view in Goals for month against month: Set weekly and monthly goals in Analytics.
What can go wrong
| Problem | Fix |
|---|---|
| The change is missing everywhere | The accounts were switched on recently. Wait for history, or use a shorter period |
| One network shows no numbers | It gives apps no data, or the connection needs a permission. Reconnect it: Reconnect a channel whose connection expired |
| The total jumped after you switched a new account on | Its posts are now part of All accounts. Choose one account in the switcher to compare it alone |
| Numbers look a day behind | Accounts are re-read every 30 minutes while you use Analytics. Use Read every account again now |
Frequently asked questions
Can I compare this month with last month?
Yes. On the Compare tab choose this month against last month. It is counted over the same number of days at the start of last month, so a month in progress is not measured against a full one. Week against last week works the same way.
Why is there no percentage next to a number?
There is not enough data about the previous period, so the change would be misleading. It appears once the account has history for that period.
Can I set custom dates?
No. The periods are 7 days, 28 days, 90 days and Year, each compared with the same length before it.
Does the comparison include TikTok?
No. TikTok, LinkedIn, X, Pinterest and Kick give Analytics no numbers today, so they are not part of the totals.
Do I compare accounts or periods in the Compare tab?
Accounts. The Compare tab puts 2 to 4 accounts side by side for the period you chose, and shows each one's change against its own previous period.
Keep reading
Export social media analytics from StreamLive Pro: a CSV of numbers per day, a CSV of every post, or a PDF report of the account and period on screen.
Compare two accounts in Analytics, per followerCompare your social accounts side by side in Analytics: a ranking, 2 to 4 accounts in columns, and account vs account per follower, fair to small Pages.
The Audience tab: age, countries, devices and hoursThe Audience tab in Analytics shows who follows or watches one account: age and gender, countries and cities, devices, subscribers, and when followers are online.
Find a post in Analytics: search, sort, paste a linkFind any post or video in Analytics: search by words of the title, paste the post's link, filter videos, lives or posts, and sort by views or engagement.
Want to try it? 7-day trial, no credit card.
Start free