 StreamLive Pro
Ask ChatGPT or Claude about your analytics
Ask ChatGPT or Claude how your channels did over 7, 28, 90 or 365 days: views, watch time, engagement, followers and live hours against the period before.
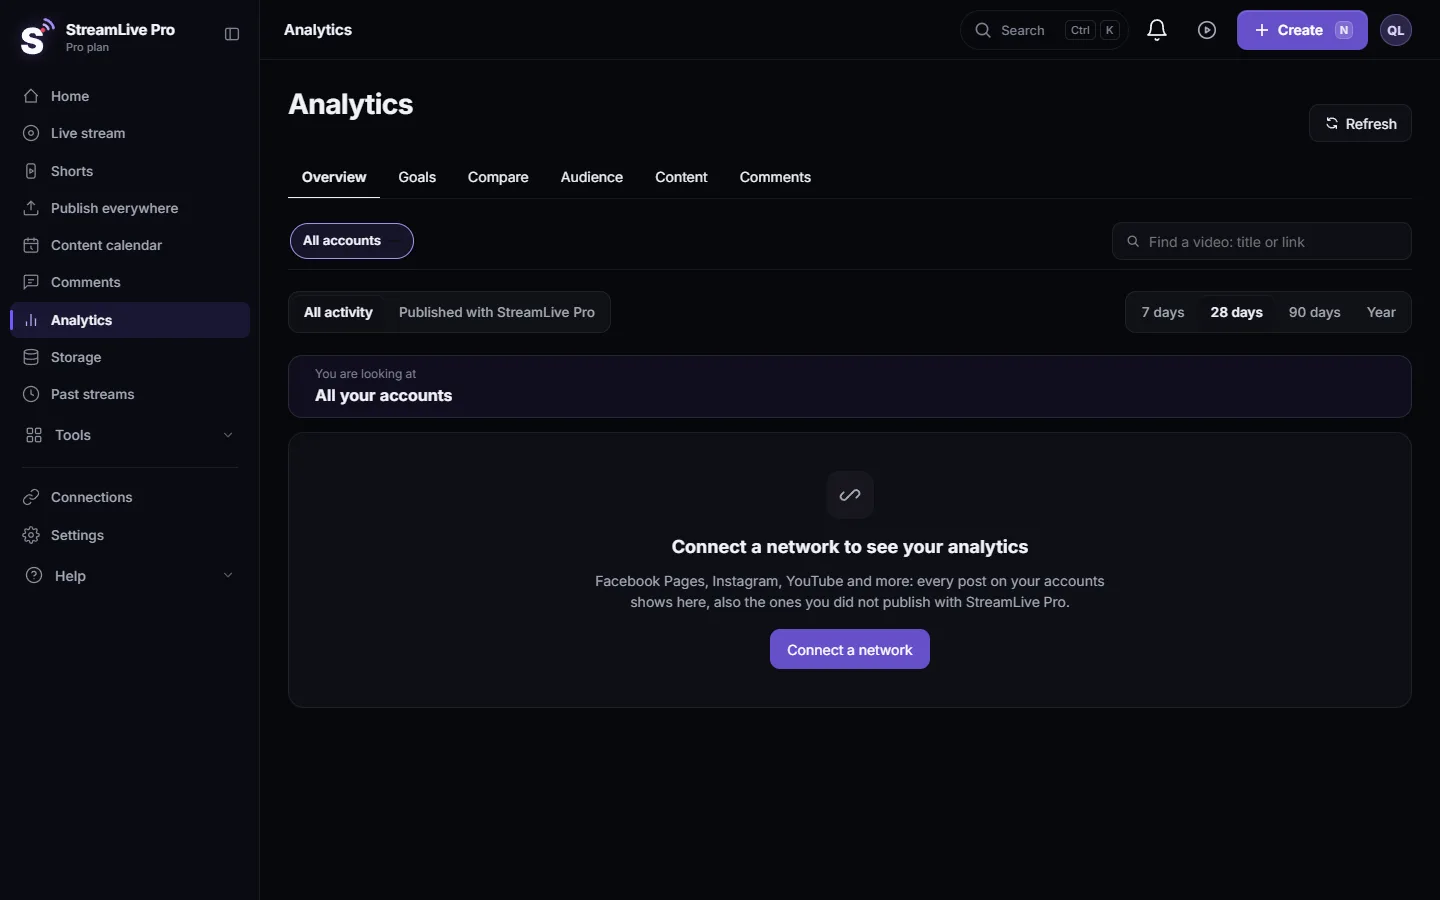
Once StreamLive Pro is connected, you can ask ChatGPT or Claude "How did this month go compared with last month?" The assistant reads a summary of your results over 7, 28, 90 or 365 days: views, watch time, engagement, posts, followers and live hours, each against the period before, split by network, with your top posts and a few insights in plain words. It reads the same summary as the overview on the Analytics page.
Before you start
- The assistant is connected: Use StreamLive Pro from ChatGPT and Claude. Results use the permission "See performance summaries", which is on by default.
- Your networks give numbers. Each connection needs the network's permission to share statistics. A network that gives no numbers is named in the answer, so you know what is missing. TikTok numbers appear only when the TikTok display permission is on for your connection.
- There is something to measure. The summary covers posts and lives made through StreamLive Pro and the connected accounts. A new account may show little in the first days.
Steps
- Pick a period. Ask for the last 7, 28, 90 or 365 days. If you do not say, the summary covers 28 days.
- Ask your question. For example: "How did my channels do in the last 7 days compared with the week before?" or "Which network grew most this quarter?"
- Focus on one network if you want. "Only YouTube, last 90 days." The summary can be limited to one network.
- Read the totals. Each total comes with the current number, the previous period and the change in percent. Followers come with the current count and the change.
- Look at the networks and the top posts. You get each network's posts, views, engagement, share of the total and change, and up to five top posts with links.
- Ask follow-up questions. "Why did views drop?" The assistant can only reason from the numbers it received; for a per-post view, open the post in Analytics: Analytics for one post: reach, engagement and audience.
- Act on it in StreamLive Pro. Plan the next live or post. For a good hour to post, see Find your best time to post from your own results.
What the summary contains
| Part | What you get |
|---|---|
| Period | 7, 28, 90 or 365 days, and the date the data is from |
| Totals | Views, watch time in minutes, engagement, posts, followers, live hours and number of lives |
| Comparison | The same numbers for the previous equal period, and the change |
| Per network | Posts, views, engagement, share of the total, change, followers |
| Top posts | Up to five, with title, type, views, link and date |
| Insights | Up to five short findings in plain words |
| Missing networks | Networks that gave no numbers for this period |
Questions that work well
- "Compare the last 28 days with the 28 days before. What changed most?"
- "Which network brings the most views for my Shorts?"
- "How many hours did I broadcast this month?"
- "What were my top 5 posts this year?"
To compare two periods on the Analytics page itself, see Compare this period with the previous one in Analytics. To read every chart on that page, see Read your social media analytics for every account.
Honest limits
- The assistant sees a summary, not raw data. It cannot export every post or build a spreadsheet from the summary alone.
- Numbers come from the networks. A network that delays its statistics, or a connection without the statistics permission, leaves a gap. The answer lists those networks.
- No custom date ranges. The summary works in fixed periods of 7, 28, 90 or 365 days.
- Treat insights as hints. They are computed from the same numbers; check a surprising one on the Analytics page.
What can go wrong
| What happens | Likely cause | Fix |
|---|---|---|
| "The summary is not available right now" | The summary could not be built at that moment | Open the Analytics page, or ask again later |
| A network is listed without numbers | The connection lacks the statistics permission, or the network shared nothing yet | Reconnect it in Connections and approve statistics |
| TikTok is missing | The TikTok display permission is off | See Analytics: every account, every post, your audience |
| "Missing permission: read:analytics" | It was unticked when you connected | Reconnect the assistant and tick it |
Frequently asked questions
Can ChatGPT read my YouTube and Facebook analytics?
Yes, through StreamLive Pro. It reads a summary per network for the period you choose, with a comparison to the period before.
Which periods can I ask about?
The last 7, 28, 90 or 365 days. Without a choice, 28 days.
Does the assistant see the same numbers as the Analytics page?
Yes. It reads the same summary as the overview on the Analytics page.
Why is one network missing from the answer?
That network gave no numbers for the period, often because the connection lacks the statistics permission. The answer names it.
Can the assistant change anything in my account from this?
No. Reading analytics changes nothing.
Keep reading
What OAuth is: how one app gets limited access to your account on another service without your password. Tokens, scopes, why connections expire, how to revoke.
Export your analytics to CSV or a PDF reportExport social media analytics from StreamLive Pro: a CSV of numbers per day, a CSV of every post, or a PDF report of the account and period on screen.
Compare two accounts in Analytics, per followerCompare your social accounts side by side in Analytics: a ranking, 2 to 4 accounts in columns, and account vs account per follower, fair to small Pages.
The Audience tab: age, countries, devices and hoursThe Audience tab in Analytics shows who follows or watches one account: age and gender, countries and cities, devices, subscribers, and when followers are online.
Want to try it? 7-day trial, no credit card.
Start free