 StreamLive Pro
Find your best time to post from your own results
Find your best time to post from your own posts: the heatmap by day and 3-hour block, how many posts it needs, and how scheduling and Publish all use it.
The card Best time to post in Analytics is built from your own posts, not from a general chart. It groups them by day of the week and 3-hour block, in your time zone, and shows which slots bring more views per post. It needs at least 8 posts with numbers. With fewer, it tells you how many you have and waits. When there is a clear winner, it names it, for example "Strongest: Tuesday 6p to 9p, 40% more than your typical post" (an example).
Before you start
- Accounts in Analytics that give numbers: Facebook Pages, Instagram, YouTube, Threads and Twitch. TikTok, LinkedIn, X, Pinterest and Kick give no numbers today, so their posts are not in the heatmap.
- Enough posts. At least 8 posts with numbers in the period. A slot is named as the strongest only when it holds at least 2 posts, so one lucky post cannot decide.
- Posts at different times. If you always post at 8 in the evening, the heatmap can only confirm 8 in the evening. Try a few other slots for two or three weeks to give it something to compare.
Steps
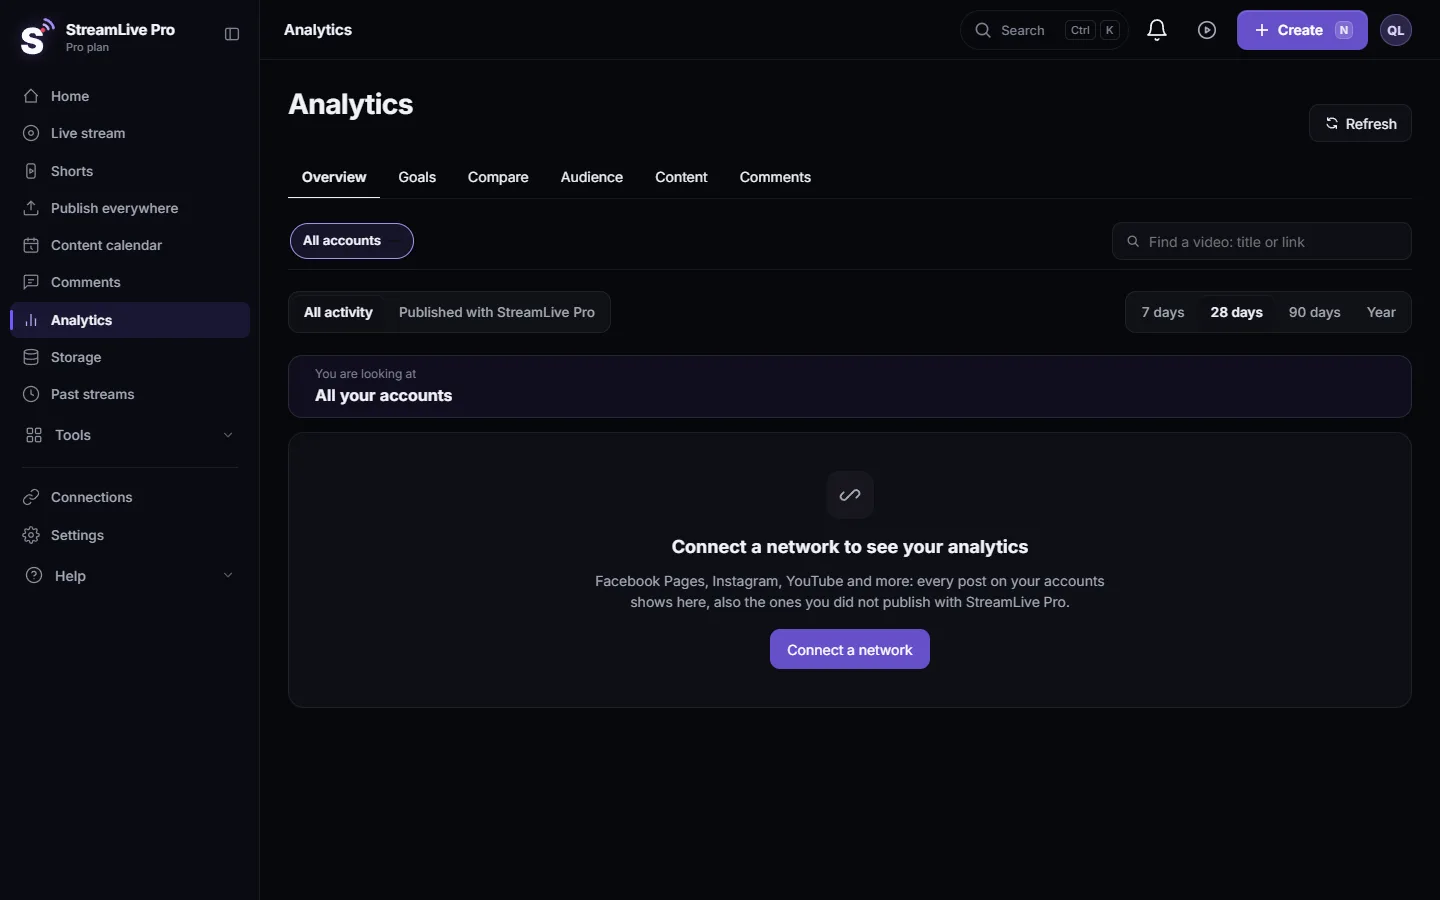
- Open Analytics. Choose Analytics. The Overview tab opens.
- Choose the accounts. In the account switcher choose All accounts, one network, or one account. A YouTube channel and an Instagram account often peak at different hours, so check each one alone.
- Choose the period. 28 or 90 days gives the heatmap more posts. 7 days rarely has 8.
- Find the card Best time to post. Rows are days of the week, columns are 3-hour blocks. Darker means more views per post. Hover a cell for its middle value and the number of posts behind it.
- Read the line above the grid. It names the strongest slot and how much more it brings than your typical post. "No time stands out yet" means the slots are close to each other.
- Check it per network. Further down, the deeper Analytics section shows the strongest day and hour for each network. For one account, the Audience view also shows when its followers are online, where the network gives that (Instagram).
- Schedule at that hour. Use the slot when you schedule posts: Schedule social media posts to several networks at once.
Where StreamLive Pro uses it for you
- Queue on the publish page. When you post, the When choice offers Now, Queue and Schedule. Queue picks the next best hour from Analytics, or 18:00 when there is not enough data yet, and says so.
- Publish all Shorts. The Publish all bar spaces Shorts one a day, at your best hour by default: Publish all your Shorts at once.
How it is measured
| Part | How |
|---|---|
| The value of a slot | The middle value of views per post published in that day and 3-hour block (interactions when the network gives no views) |
| Your typical post | The middle value of all your posts in the heatmap |
| "% more than your typical post" | The strongest slot compared with your typical post |
| Time zone | Yours, so a slot means the same hour on your clock |
The middle value (median) is used on purpose: one post that went viral does not paint its whole slot dark.
Reading it honestly
- It shows when your posts did well, not when people are online. A slot can be strong because your best topics happened to go out then. Treat it as a hint and test it.
- Few posts, big swings. With 8 to 15 posts, one change can move the strongest slot. The picture settles as posts add up.
- Formats differ. A Short and a long video can peak at different hours. Look at one account or network at a time.
Related pages
- Read your social media analytics for every account
- Set weekly and monthly goals in Analytics
- Analytics for one post: reach, engagement and audience
What can go wrong
| Problem | Fix |
|---|---|
| "We need at least 8 posts with numbers" | Choose a longer period, switch on more accounts, or post more before you read it |
| "No time stands out yet" | Your slots are close. Keep the hours that suit you |
| TikTok posts are missing | TikTok gives Analytics no numbers today |
| The hours look shifted | Check the time zone of your computer; the heatmap uses yours |
Frequently asked questions
What is my best time to post?
Open Analytics, choose 28 or 90 days, and read the card Best time to post. It names the slot where your own posts got the most views per post.
How many posts does it need?
At least 8 posts with numbers in the chosen period. A slot needs at least 2 posts to be named the strongest.
Is the time in my time zone?
Yes. Days and hours are on your own clock.
Does it use other people's data?
No. It is built only from the posts on your own accounts.
Can StreamLive Pro schedule posts at that hour by itself?
When you choose Queue on the publish page, or use Publish all for Shorts, the time is taken from your best hour. You still decide what is posted.
Keep reading
How to live stream a product launch: announce it ahead, live demo or a pre-recorded video at a set time, questions from the chat, and Shorts that keep selling after.
Hootsuite alternative for creators: vs StreamLive ProHootsuite alternative for video creators: plans, trial, networks, inbox, analytics and AI, vs live streaming and Shorts, from Hootsuite's pages checked November 2026.
Buffer alternative for video posting: Buffer vs StreamLive ProBuffer alternative for video posting: networks, scheduling, TikTok, comments, analytics, plus live streaming and Shorts, from Buffer's own pages checked November 2026.
StreamLive Pro dashboard tour: where everything isA tour of the StreamLive Pro dashboard: what each menu item does, where Billing, Settings and the tools live, and the fastest way to find a screen.
Want to try it? 7-day trial, no credit card.
Start free