 StreamLive Pro
The summary at the top of Analytics, explained
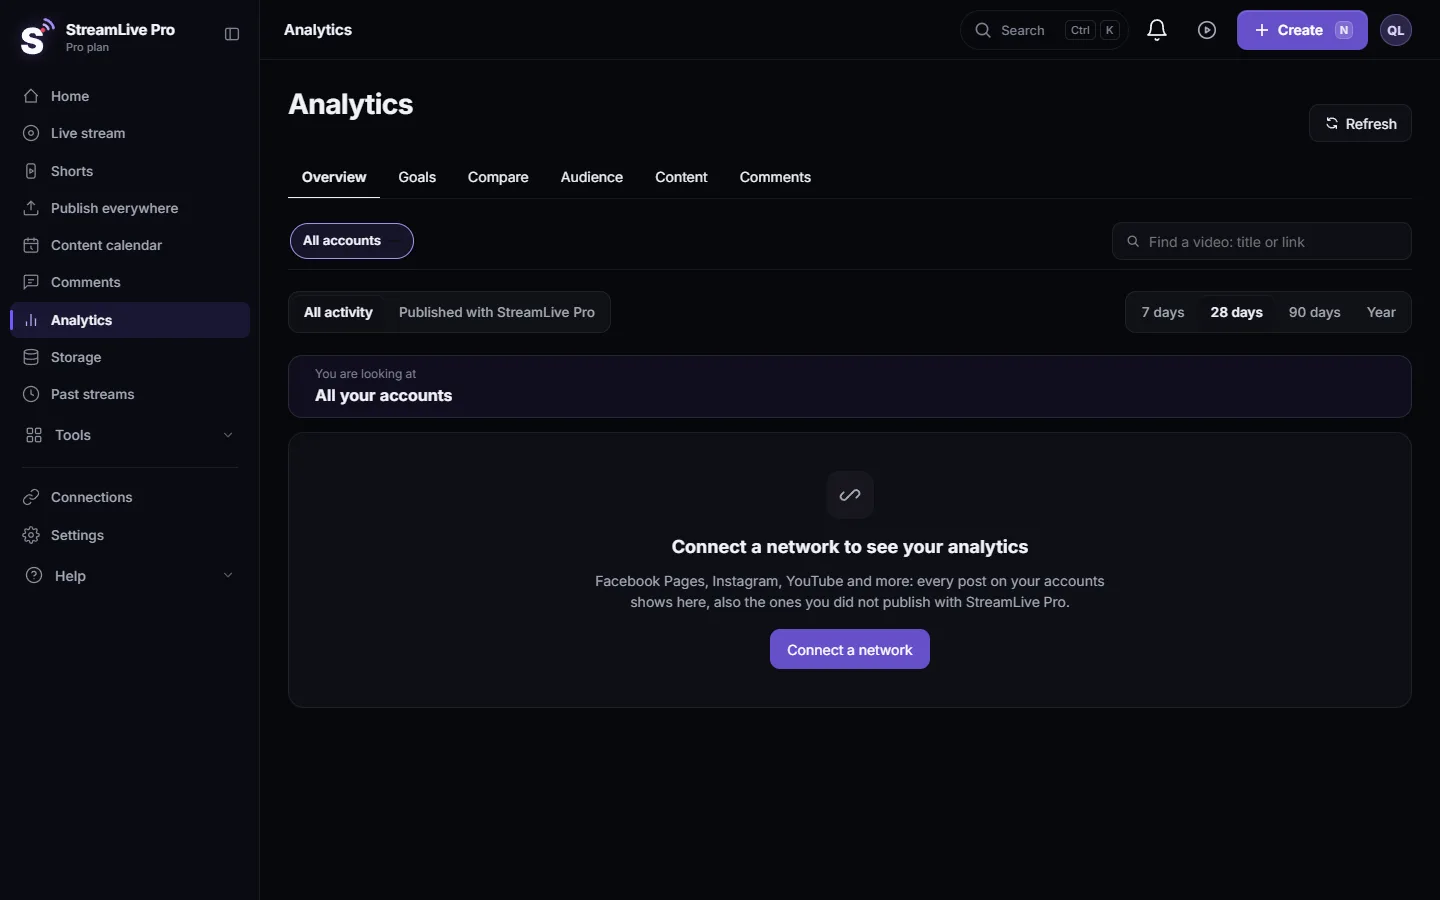
The one-line summary at the top of the Analytics Overview: views in the period, the change, the leading network, your best post, and what StreamLive Pro brought.
The Overview tab of Analytics opens with one sentence before any chart. It answers the first question most people have, "how did we do", in words: how many views your accounts had in the period, how that compares with the period before, which network brought most of them, and whether one post did much better than your usual. Under it, a second line says how much of that came from what you published with StreamLive Pro. The rest of the Overview is the detail behind that sentence.
The parts of the sentence
| Part | Example (numbers are examples) | When it appears |
|---|---|---|
| Views in the period | "18,400 views in the last 28 days" | When the networks report views; otherwise the number of posts |
| Change | "12% more than the 28 days before" | When there is data about the previous period |
| Leading network | "YouTube brought 61% of them." | When more than one network is in the period |
| Best post | "Your best post did 2.4x your usual." | When one post reached at least 1.5 times your usual |
| Via StreamLive Pro | "9 of 14 posts were published with StreamLive Pro, bringing 72% of the views." | In All activity, when some posts went out from StreamLive Pro |
The sentence follows the account switcher and the period. Choose one Page and 7 days, and it describes that Page's week. If the accounts give no views, it counts posts instead.
When there is nothing to say yet, it says that plainly: "Connect a network to see what happens on your accounts." or "No posts in this period yet."
Where each part comes from
- Views and change are the same numbers as the Views tile under the sentence, against the previous period of the same length. See Compare this period with the previous one in Analytics.
- Leading network is the By network split further down the page.
- Your usual is the middle value of your other posts on the same account, the same measure used on each post's page: Analytics for one post: reach, engagement and audience.
- Via StreamLive Pro counts posts and lives that went out from StreamLive Pro. Click Show only those, or set the scope to Published with StreamLive Pro, to see only them.
The rest of the Overview, in order
- Key numbers. Views, interactions (likes, comments, shares and saves), followers, posts published and watch time, each with its change.
- Per day. A chart by network. On Facebook, Instagram and YouTube it counts every view on the account that day; on other networks it counts the posts published that day.
- Your accounts. One card per account, with its state.
- By network. Each network's share of the views.
- Best posts. Thumbnails with "x your usual".
- Best time to post. A heatmap of the days and hours your posts did best: Find your best time to post from your own results.
Reading it well
- A big percentage on a small account is common: from 200 views to 600 is +200%. Read the number before the percentage.
- "Your best post did 3x your usual" points to something worth repeating: open the post from Best posts and look at its topic, length and the hour it went out.
- If the leading network surprises you, check whether one account was switched on recently; its posts now count in All accounts. See Read your social media analytics for every account.
- The sentence never estimates. If a network does not report views, those posts are counted as posts, not guessed as views.
A weekly use, for example
On Monday morning set the period to 7 days and read only the sentence. If views went down and no post beat your usual, the week needs a stronger post, not more posts: look at Best posts from the last 28 days and repeat what worked. If one network brought most of the views, open that network's posts in the Content tab and check which formats carried it. Then schedule the coming week at the hours the heatmap suggests: Schedule social media posts to several networks at once.
Frequently asked questions
What does "Your best post did 2x your usual" mean?
One post in the period reached twice the middle value of your other posts on the same account. It appears only when a post reached at least 1.5 times your usual.
Why does the summary count posts instead of views?
The accounts shown give no view numbers for the period, for example a Facebook Page before Meta approves the read insights permission. Posts are counted instead of guessing.
Does the summary include posts I did not publish with StreamLive Pro?
Yes, in All activity. The second line says how many of them went out from StreamLive Pro and what share of the views they brought.
Why is there no percentage change?
There is not enough data about the previous period yet, for example an account switched on recently. The change appears once that history exists.
Keep reading
Export social media analytics from StreamLive Pro: a CSV of numbers per day, a CSV of every post, or a PDF report of the account and period on screen.
Compare two accounts in Analytics, per followerCompare your social accounts side by side in Analytics: a ranking, 2 to 4 accounts in columns, and account vs account per follower, fair to small Pages.
The Audience tab: age, countries, devices and hoursThe Audience tab in Analytics shows who follows or watches one account: age and gender, countries and cities, devices, subscribers, and when followers are online.
Find a post in Analytics: search, sort, paste a linkFind any post or video in Analytics: search by words of the title, paste the post's link, filter videos, lives or posts, and sort by views or engagement.
Want to try it? 7-day trial, no credit card.
Start free